What the reward : risk ratio tells you
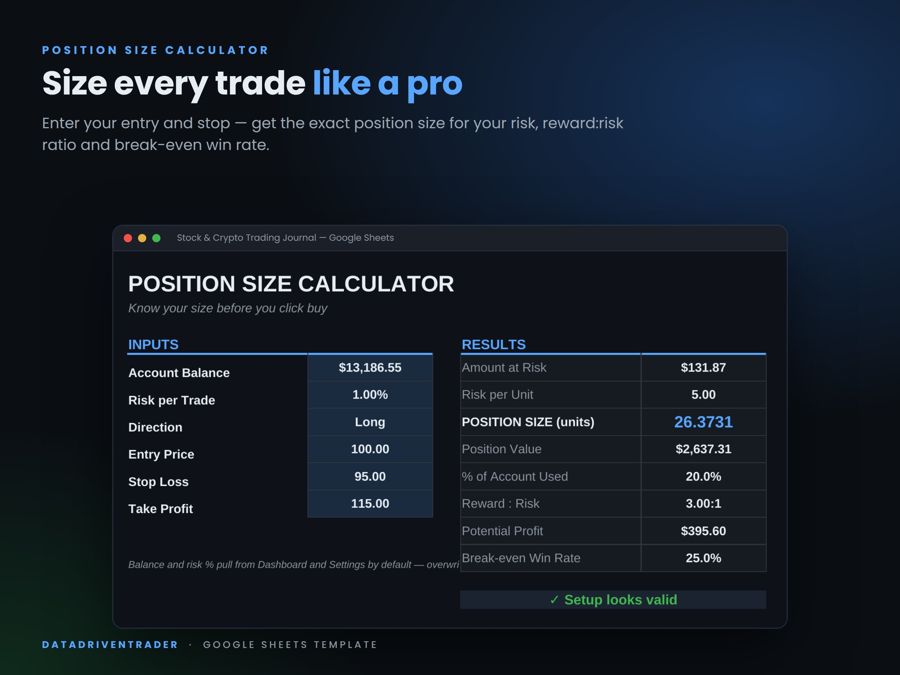
The reward : risk ratio (also written R:R or risk/reward) compares how much you can make at your take profit with how much you lose at your stop loss. A trade that risks $100 to make $250 has a ratio of 2.5 : 1. It is the quickest way to see whether a trade idea is worth taking before you open it.
For a short, the directions flip: the stop is above the entry and the target below it.
Worked example
Long Bitcoin at $60,000, stop at $58,500, target at $64,500.
- Risk: $1,500 per coin (2.5%). Reward: $4,500 per coin (7.5%).
- Reward : risk = 4,500 ÷ 1,500 = 3 : 1
- Break-even win rate = 1 ÷ (1 + 3) = 25%
- With a $10,000 account and 1% risk, the loss at the stop is $100 and the profit at the target is $300.
At 3 : 1 you can be wrong three times out of four and still break even, before fees.
Break-even win rate by reward : risk
| Reward : risk | Win rate needed to break even |
|---|---|
| 0.5 : 1 | 66.7% |
| 1 : 1 | 50.0% |
| 1.5 : 1 | 40.0% |
| 2 : 1 | 33.3% |
| 3 : 1 | 25.0% |
| 5 : 1 | 16.7% |
Expectancy: the number that matters
Reward : risk alone doesn't tell you if a strategy makes money. A 5 : 1 setup that hits its target 10% of the time still loses. What matters is the combination of ratio and win rate, called expectancy:
With a 40% win rate and 3 : 1, expectancy is 0.4 × 3 − 0.6 = +0.6 R. Every trade earns 0.6 times your risk on average, so $60 per trade if you risk $100. Enter your win rate above and the calculator shows it, plus the expected result over 100 trades.
The win rate vs expectancy guide goes deeper, including how many trades you need before your win rate means anything.
Common mistakes
- Picking the target to get a nice ratio. Moving the target further away improves R:R on paper but lowers the chance of reaching it. Set targets where the market is likely to go, then check the ratio.
- Moving the stop after entry. A wider stop changes the ratio you planned with, and usually the loss.
- Forgetting fees. On tight stops, round-trip fees can be 10% or more of the risk. Use the break-even calculator to see their effect.
Frequently asked questions
What is a good reward to risk ratio?
There is no universal number. Many swing traders aim for 2 : 1 or more, while some high win-rate strategies work at 1 : 1 or below. What matters is that your win rate is above the break-even win rate for your ratio.
Is it written risk:reward or reward:risk?
Both are used. "1:3 risk to reward" and "3:1 reward to risk" mean the same trade: you risk 1 to make 3. This calculator shows reward first, so higher is better.
Does leverage change the reward to risk ratio?
No. The ratio depends only on the entry, stop and target prices. Leverage changes the margin you need, and how close liquidation is.
Related
Results are based on the prices you enter and ignore fees and slippage. Nothing on this site is financial advice.